
Data-Driven Energy Analysis
How the world's energy systems actually work
Analysis of power grids, data center energy, and renewable infrastructure. No spin, just data.
View latest analysis
Data-Driven Energy Analysis
Analysis of power grids, data center energy, and renewable infrastructure. No spin, just data.
View latest analysis
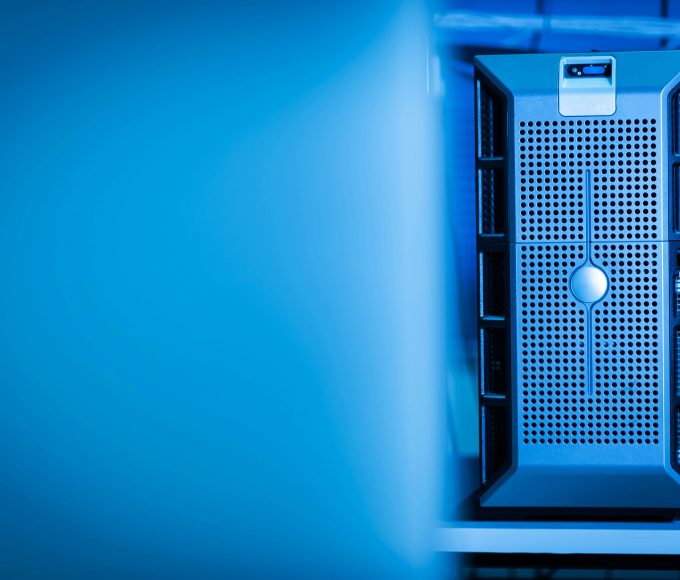
Power usage effectiveness, or PUE, is the standard metric for measuring how efficiently a data center uses energy. It is calculated by dividing the total energy consumed by the facility by the energy consumed specifically by the IT equipment inside it. A PUE of 2.0 means the facility uses twice as much total energy as its servers consume, with the other half going to cooling, lighting, power distribution, and other overhead. A PUE of 1.0 would mean perfect efficiency, with every watt going directly to computing. No real facility achieves this.
The metric was developed by The Green Grid, an industry consortium, in 2007. It quickly became the universal benchmark for data center energy performance because of its simplicity. A single number captures the relationship between useful computing work and the total energy required to support it. The Uptime Institute has tracked average PUE across the industry since 2007, when the global average exceeded 2.5. By 2024, the average had improved to approximately 1.56, representing significant but decelerating progress.
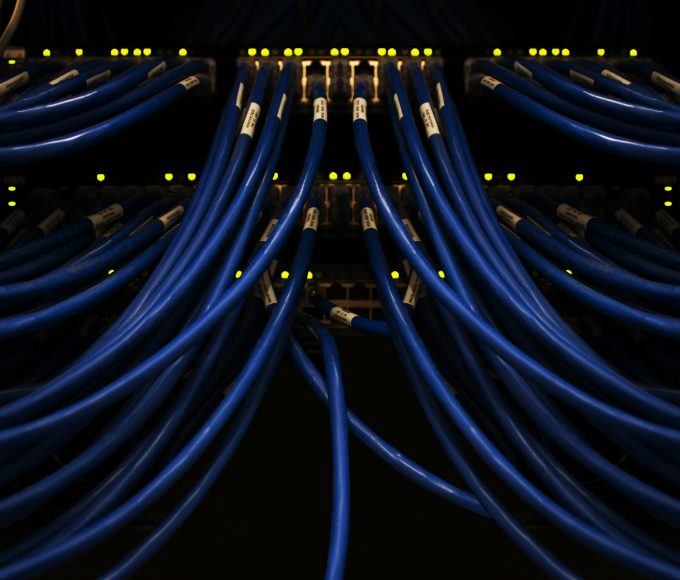
The formula is straightforward: PUE equals total facility energy divided by IT equipment energy. Total facility energy includes everything the data center consumes: servers, storage, networking equipment, cooling systems, power distribution units, lighting, and security systems. IT equipment energy includes only the servers, storage devices, and network hardware doing actual computing work.
In practice, measuring PUE accurately is more complex than the formula suggests. Different organizations measure at different points in the power chain, which can produce different results. Some measure IT load at the server level, others at the output of the uninterruptible power supply. The location of measurement matters because energy is lost at each conversion step between the utility meter and the chip. Industry standards from ISO and The Green Grid now specify measurement boundaries, but inconsistencies persist across reporting.
The best hyperscale operators achieve PUE ratings between 1.1 and 1.2. Google reported a fleet-wide PUE of 1.10 across its data centers. Meta has achieved similar figures at its custom-built facilities. These operators benefit from massive scale, custom-designed infrastructure, and locations chosen specifically for favorable climates that reduce cooling loads.
Enterprise data centers typically operate at higher PUE values, between 1.4 and 1.8. Older facilities that were not designed with modern efficiency standards often run above 2.0. The gap between hyperscale and enterprise PUE reflects differences in design, scale, climate, and the age of the infrastructure. Retrofitting an existing facility to match hyperscale efficiency is often prohibitively expensive.
After rapid improvements between 2007 and 2015, global average PUE has plateaued. Several factors explain this. The easiest efficiency gains, such as raising server inlet temperatures and using hot-aisle containment, have already been widely adopted. Further improvements require more expensive interventions like liquid cooling or relocating to colder climates. Additionally, AI workloads are increasing power density per rack, which creates more concentrated heat that is harder to remove efficiently.
There is also a measurement problem. PUE captures overhead efficiency but says nothing about whether the IT equipment itself is being used productively. A data center with excellent PUE could still be running servers at low utilization, wasting the computing power that the efficient infrastructure delivers. This limitation has led to growing interest in complementary metrics like carbon usage effectiveness, water usage effectiveness, and server utilization rates.
As AI drives data center power density from 10-15 kilowatts per rack toward 40-100 kilowatts per rack, traditional air cooling becomes insufficient. Liquid cooling, which transfers heat far more efficiently, is becoming essential for high-density deployments. Facilities designed around liquid cooling can achieve lower PUE values because they eliminate much of the energy-intensive air handling infrastructure. The shift to liquid cooling may restart PUE improvement after years of stagnation, but it requires fundamental changes in data center design and operations.
Key Takeaway PUE measures how efficiently a data center uses energy. A...
What Edge Computing Means Edge computing is an architectural approach that moves...
Why Data Centers Use Water Water is one of the most efficient...
Why Grid Connection Is the Bottleneck A data center is only as...

Leave a comment